Friday, July 15, 2022

Perturb-Seq in Our Database

We've updated our database with data from a recent, massive, perturb-seq study in which more than 8,000 transcripts were knocked-down using crispr-i. See our previous post, and Mapping information-rich genotype-phenotype landscapes with genome-scale Perturb-seq for more info. This new data means that a total of about 85,000 gene lists can now be found in our database.

The study actually generated two massive knockdown datasets, one involving K562 cells, and the other involving the RPE1 line. We've added both of these datasets to the database. As we pointed out in the previous post, the K562 matrix can be read as either a series of knockdown studies (e.g. what is upregulated when gene XYZ is knocked down?), or as a crispr screen (e.g. what are the genes whose knockdown downregulates XYZ?). As you'll see below, you can examine the K562 dataset in either way. In the case of the RPE1 set, only the results of knockdowns can be examined. This is because "only" about 2,000 genes were knocked down in the RPE1 study, meaning that the background of the RPE1 crispr-screen results is fairly small. We like big backgrounds. Looking at our previous post, the K562 results can be represented as a fairly square-shaped matrix, but the RPE1 results are a long rectangle.

Integrating this data into our database wasn't entirely straightforward. The sheer volume of the data can slow down processing considerably. Also, the presence of massive data generated from a single lab, with a single protocol, with only two cell lines, wreaks havoc on the output of some of our programs. Thus, we had to tweak several of our apps to accommodate the new data.

For the Relevant Studies app, the addition of the data is not problematic. You may not be interested in these perturb-seq results, however, so a "standard" search excludes perturb-seq results. You can include perturb-seq results by scrolling down to the bottom of the black bar on the left side of the page and making a choice in the "Database" box. If, for some reason, you're only interested in perturb-seq, you can type "perturb-seq" in the "Keyword" box (be sure, of course, to choose perturb-seq in the Database box as well).

For the Co-Expression app, we don't want to mix the results of a single monster study involving two cell lines/one lab/one protocol with our standard database. All the pitfalls of the perturb-seq approach* would come to the fore and dominate results if we mixed databases. Thus you can go to "Database" and choose the standard database, the perturb-seq knockdown database, or the perturb-seq crispr-screen database, but you can't combine these datasets**. Since the "Regulation" app also performs co-expression analysis, the same database limitations apply. 

For the Fisher app, Match Studies app, and Third Set app, our main concern is speed. Thus, as with the Relevant studies app, the default is to use our standard database. Again, you can change that in the Database box.

No insight is gained by including the perturb-seq studies in our "Cell Types" app. Thus only the standard database is interrogated when you ask the question, "in what cell types does my gene of interest tend to be perturbed?"

Presumably, the frequency with which these sorts of massive datasets are released will increase in the future. We'll add these studies to the database as they come.


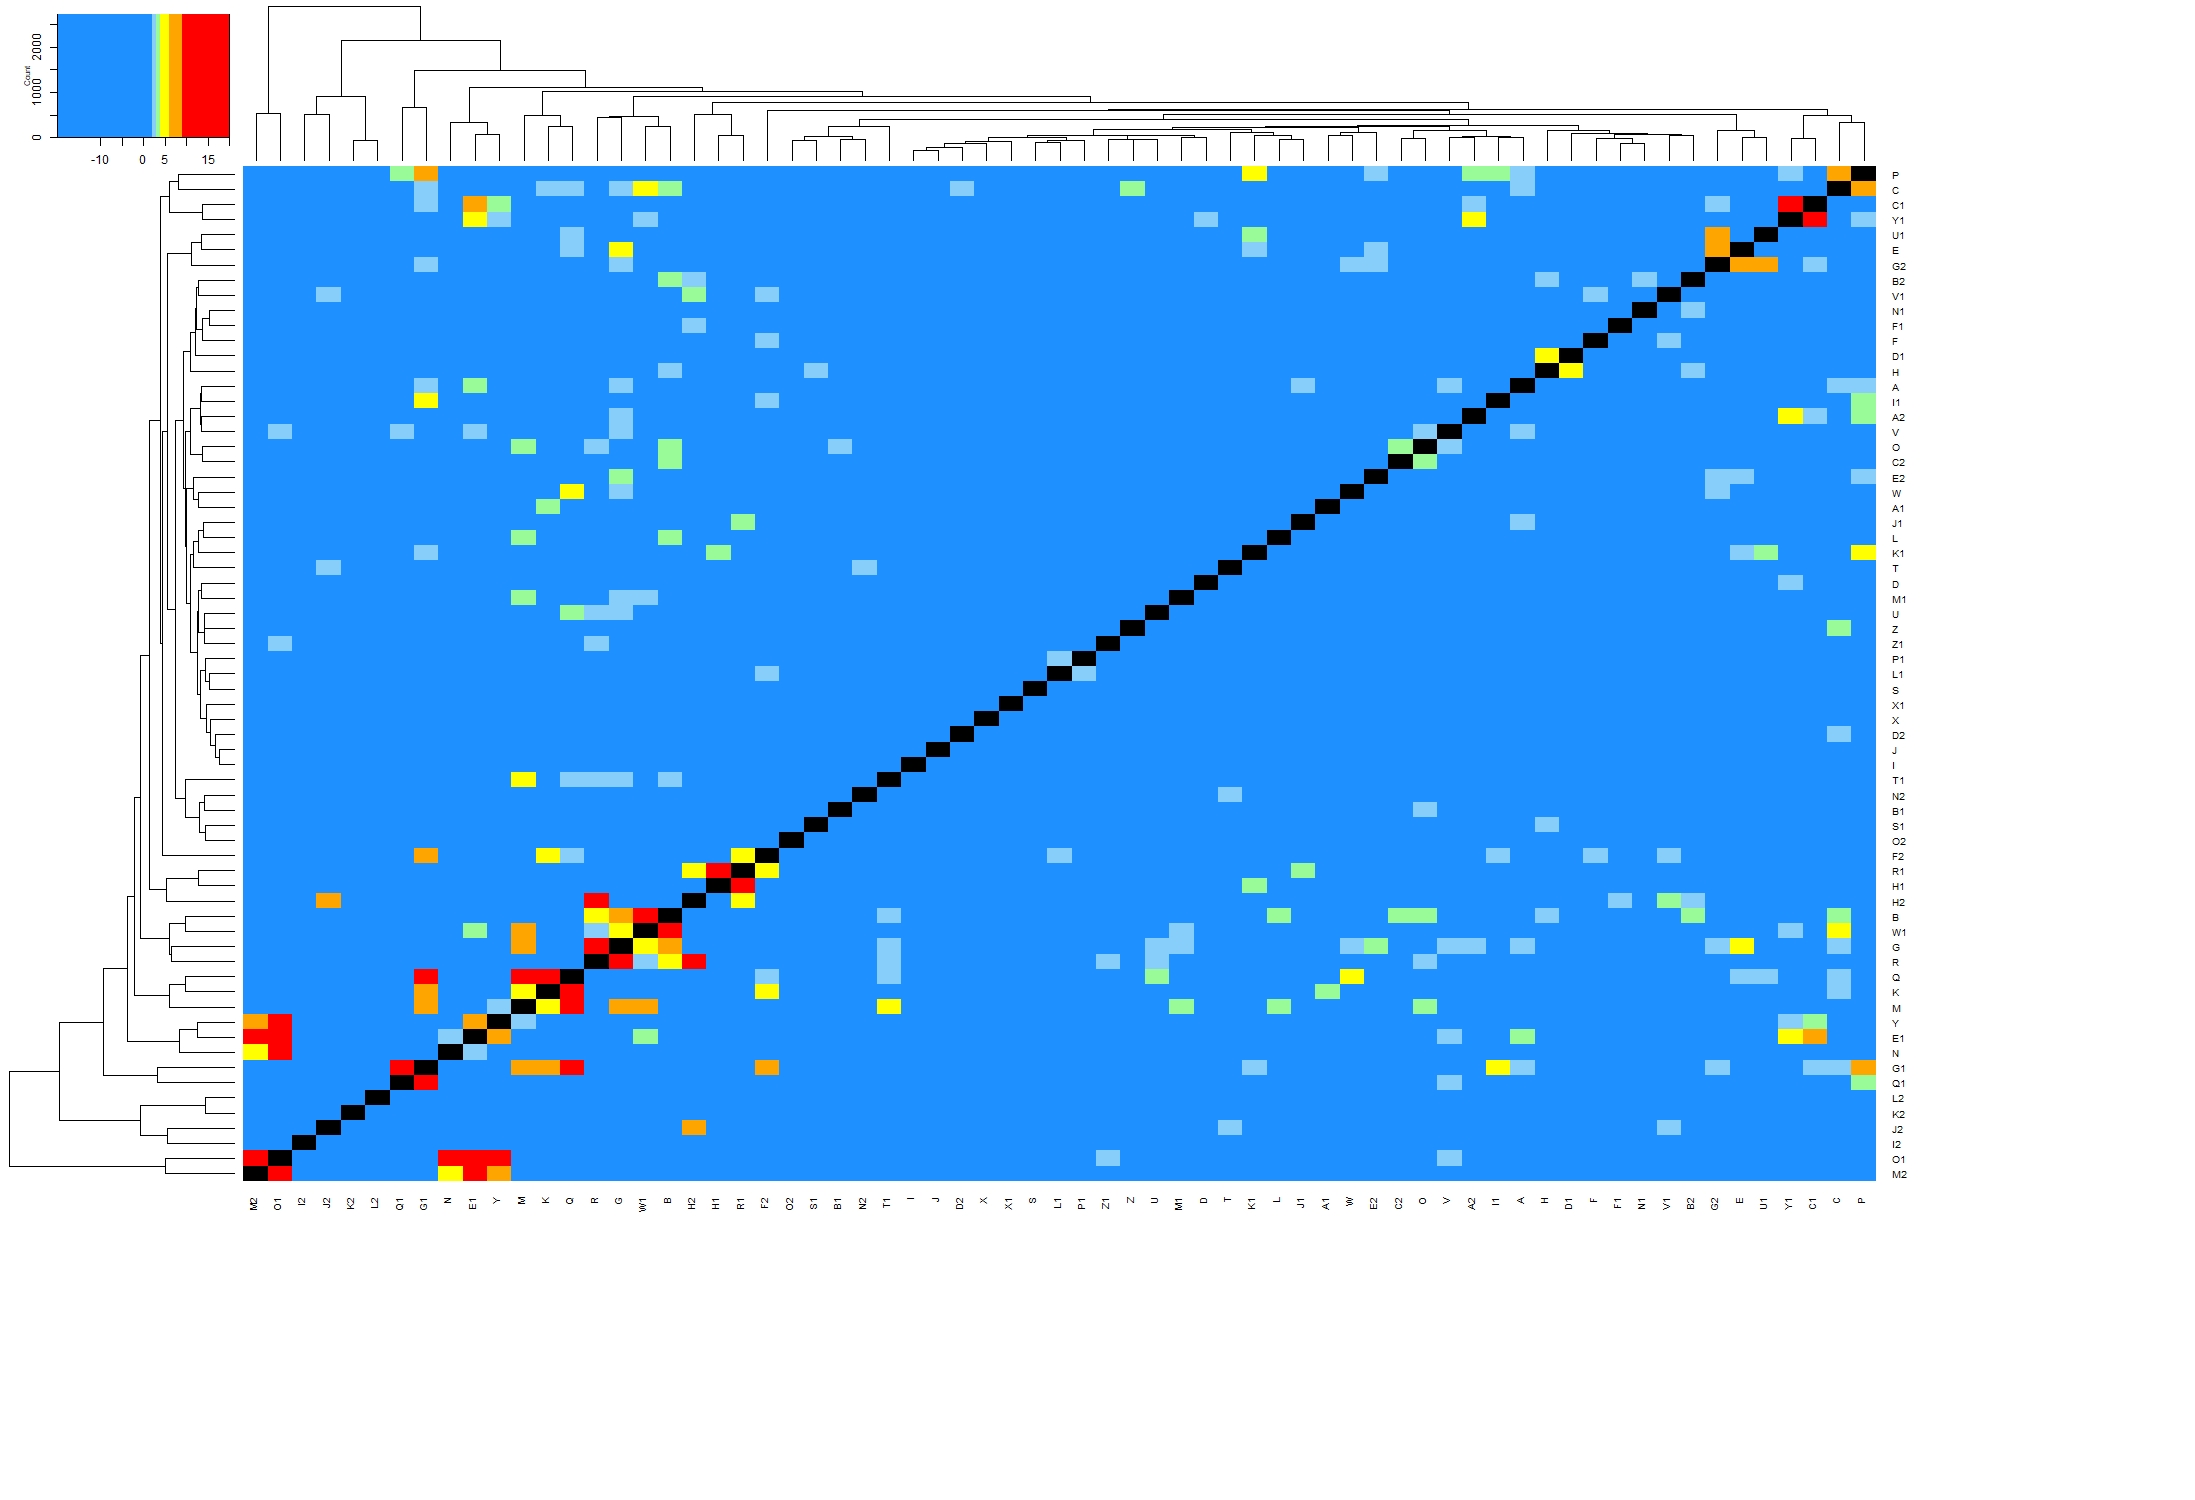
*Unmentioned in our previous post is the following: the results of the K562 and RPE1 knockdowns overlap quite weakly. That is, if you choose a gene that was knocked down in both studies, and look for correlation in the two altered transcriptomes, you'll probably be disappointed. The perturb-seq paper devotes a paragraph to this result, but does not really offer insight into why such weak correlation is seen. Hopefully, our previous post makes it somewhat clear that overlap between transcriptomic studies that target the same gene, but use different cell lines and targeting approaches (knockout/down, drug, etc) is not unusual or unexpected.


**You can't combine the crispr-i and crispr-screen results, either. My underlying thinking is that since one is just the transpose of the other, it's a bit incestuous to mix the two sets and then perform analysis. There's probably a name for an associated statistical error here. Admittedly, I haven't thought this out fully, but it just seems safer to keep the two sets separate.


whatismygene.com 


Tuesday, July 5, 2022

Crispr-i Vs Conventional Knockdown

It is now possible to read out the transcriptional alterations induced by alteration of every gene in the genome in a single experiment. Actually, this has been possible since the advent of microarrays, but recent advances in crispr and single-cell sequencing technologies means the feat can be accomplished without gargantuan expenditures. Crispr inhibition ("crispr knockdown" or "crispri") clogs up the promoter of any gene of interest. Bar codes allow the experimenter to know which gene has been clogged. And single-cell sequencing gives you the transcriptome of a clogged cell. After intensive computation, you get a simple matrix of genes knocked down and genes altered.


Above is a very small matrix. The yellow column shows genes that are knocked down. The blue row shows genes examined for alterations. The matrix needn't be square...in the study we'll be talking about, there were more genes examined than genes knocked down. So, you can see that knocking down pd-l1 strongly upregulates tubb in this very hypothetical example. Here, the gene of interest is found in the yellow column. But the gene of interest can also be found in the blue row. So, for example, you can ask, "What are the genes whose knockdown upregulates ifn?" There, pd-l1 knockdown does the best job of upregulating ifn. This is the approach taken in crispr and rnai experiments that ask questions like, "What genes most strongly control the expression of cancer migratory factor XYZ?"

The study of interest is here. K562 cells were used. Roughly 8,000 genes were knocked down, and 10,000 genes were examined for transcriptional alterations. Typically, 100 cells were examined for a particular knockdown, meaning that more than a million single cells were sequenced. We'll be adding the data to our database, but we need to make a few tweaks to our system to accomodate the data. However, we have some preliminary results of combining this "perturb-seq" dataset with our own data. Below, we discuss these results. They're weird.

First, a bit more background. Crispri is often referred to as a "knockdown." The gene of interest hasn't been mutated or deleted. A protein and RNA guide simply clog up a promoter. Thus, as with standard rnai, knockdown can be of varying efficiency. In both forms of knockdown, off-target effects are also possible. However, crispri differs (profoundly, we believe) from standard rnai in that the knockdown occurs right at the DNA/RNA interface, at the level of transcription, while rnai functions after full-length transcripts have already been generated. Rnai results in by-products of cleaved RNA and/or protein-bound transcripts with inhibited translation.

Despite the differences in these two knockdown approaches, it seems reasonable to expect that both sorts of knockdowns should have similar transcriptomic effects. In both cases, simple RT-PCR can tell you that the gene of interest has been stymied by, say, 90%. In both cases, there isn't much transcript floating around for translation into protein. Nevertheless, experimental comparisons between the approaches are necessary. Unfortunately, we don't see extensive examples of such comparisons. Probably the best study is found here. Surprisingly, even in a controlled setting using a single cell line (Hela), the transcriptomic readouts of crispri and rnai did not match up particularly well. We note another possible comparison here. The comparison is less than ideal, however, since the experimenters abandoned crispri in favor of rnai because of less-than-desirable knockdown efficiency.

To more closely examine the discrepancies between crispri and more conventional means of altering gene expression (knockdown/out, overexpression, drug targeting, mutation), we first sought out the most commonly altered genes in our database. TP53 ranks first, with a total of 45 studies targeting it. Unfortunately, TP53 was not strongly downregulated in the k562 perturb-seq data on which we operated; this particular crispri knockdown was not particularly effective.

The next most commonly targeted gene in the database is TGF-b, with a total of 36 studies. The gene is indeed the single-most strongly downregulated gene upon TGF-b perturb-seq knockdown. However, we have a new problem in comparing conventional studies against crispri; all but 3 of the above studies involve treatment. That is, cells are bathed in TGF-b. It would not be fair to expect perturb-seq results to parallel these treatment results. Nevertheless, we note the following:

*The single conventional TGF-b knockdown study actually mimicked TGF treatment fairly well, albeit in opposite directions (i.e. genes upregulated in the knockdown are downregulated upon treatment, and vice-versa).

*Perturb-seq results did not match up with any significance with ANY of the above 36 studies.

Given the time we spent tinkering with TGF-b data, we constructed lists of genes that are canonically up/down-regulated on TGF-b treatment: database IDs 145169203 and 145170203 (to be available upon our next database update).

EZH2 is targeted 32 times in our database. This time, it is strongly downregulated on crispri treatment. We also have a variety of knockdown/out, overexpression, mutation, drug-targeting results relating to EZH2. Do any of these studies at all match up with the perturb-seq results?

No.

To be fair, there's not a lot of study/study overlap here. Presumably, that's because the effects of EZH2 alteration depend strongly on cell type. Below is a heat map showing EZH2 study/study P-values. Bear in mind that the underlying gene lists are divided into up- and down-regulated portions...even in a best case scenario, half of the lists aren't expected to overlap. Nevertheless, green/yellow/orange/red color makes it clear that most studies overlap with at least one other study with decent significance. The up/down lists for perturb-seq, N2 and O2, however, lie smack in the least colorful columns/rows of the heatmap. In fact, the single best EZH2-related match for perturb-seq is this: genes that are upregulated under perturb-seq crispri tend to be downregulated under standard EZH2 KO in an MBA-MB-231 line (log(P)=-2.8, see GSE48979).


Given the plethora of EZH2 studies, we compiled lists of genes that are canonically altered upon EZH2 targeting: dbase IDs 145171203 and 145172203. As one might guess, however, EZH2 alteration doesn't tend to affect particular genes repeatedly from study to study. The single strongest tendency was for IGF2BP3 to be upregulated on EZH2 downregulation, but this was only seen in 6 of 30 studies. Nevertheless, it was interesting to see that the list of genes that are canonically up-regulated on EZH2 downregulation overlapped strongly with a number of viral infection studies. For example, genes that are downregulated in foreskins on 96-hour HCMV infection (vs 12 hours; see GSE112514) overlap with genes canonically downregulated on EZH2 knockout at log(P) = -21. It seems that viruses are motivated to see EZH2 sequestered and/or knocked-down.

If I were writing an academic paper, I'd continue with the above sort of analysis, showing that standard knockout/down, overexpression, drug inhibition, and mutation studies involving a particular target can be found to overlap to some extent, but crispri simply does not overlap with these studies.


whatismygene.com 


A Preprint

It has been a while since we posted. That's largely because of the effort put into generating a paper. Check it out on BioRxiv . This is...