Saturday, June 18, 2022

Transcription Factors that Bind to Ultraconserved Sequences

We recently added more than human 700 chip-seq results to our database. If, say, your list of genes upregulated on XYZ knockout overlaps with genes that are bound by transcription factor ABC, you’ll probably know shortly after you plug your list into our “Fisher” tool. Conversely, if your own chip-seq list corresponds with a knockout or overexpression result, you’ll know.

We’ve got a lot to say about transcription factors. But for now, we’ll point to a single result of interest: there are a number of transcription factors that seem to have a very strong proclivity to bind on or near ultraconserved DNA regions. If you’re not informed on the subject of ultraconservation, google it. As far as I’m concerned, it’s the biggest mystery in biology. How is it that certain sequences of DNA, some exceeding 1000 bases, show perfect homology to DNA found in chickens and/or fish? Bear in mind that many of these sequences are not protein-coding sequences, and that even in the case of ultraconserved protein-coding sequences, no synonymous mutations are seen between humans and chickens (which diverged more than 300 million years ago). Adding to the weirdness, some deletions of ultraconserved regions in mice result in…perfectly happy mice.

Given our fascination with the subject, we’ve loaded a number of lists relating to ultraconservation into our database. Using the list “longer list of genes within or near ultraconserved sequences (ucnebase)” (database ID 112314101), we looked for overlaps with freshly-added chip-seq results. The results were quite powerful: outside of other ultraconservation-related lists, the single best correlation with this “longer list” was with DNA sequences that are bound by the transcription factor PCGF2. Here are the chip-seq-related P-values:

PCGF2 chip-seq targets in multiple cell lines: 10-83

PHC1 chip-seq targets in HEK293: 10-74

AEBP2 chip seq targets in multiple cell lines: 10-65

EPOP chip-seq targets in NT2-D1 line: 10-62

JARID2 chip seq targets in multiple cell lines: 10-52

PCGF1 chip-seq targets in HEK293: 10-27

EZH2 chip seq targets in multiple cell lines: 10-22

Needless to say, the vast majority of chip-seq results in our database do not overlap with ultraconserved DNA at any significance. Note that 4 of the 7 results above involve the Polycomb group of proteins. These proteins also tend to interact. For example, check out the PCGF2 interaction network.

These results could be very interesting and worth some follow up. It is worth remembering, however, that ultraconserved sequences are known to have high AT content, and at least some of the above TFs (e.g. JARID2) bind high-AT sequences. Thus, the binding of these TFs to ultraconserved sequences does not necessarily help to solve the mystery of ultraconservation. One step for further inquiry would be to examine the specific DNA stretches that are pulled down with these TFs. Are they uniformly AT-enriched? Are these stretches themselves ultraconserved, or simply nearby ultraconserved genes (our gene-centric lists do not discriminate between the two)?

A 2013 study pulled down protein-bound ultraconserved sequences and performed mass-spec on these proteins. The resulting list of binding proteins is not enriched for the above 7 chip-seq derived proteins. An explanation for ultraconservation offered in the papers is that ultraconserved sequences appear to have an excess of overlapping TF binding sites (relative to non-ultraconserved sequences). That’s a partial explanation for ultraconservation at best. Presumably, there’s evolutionary pressure for these TFs to bind at these sites…what is the nature of that pressure?*

Non-chip-seq lists that strongly overlap with ultraconserved genes include genes with homeoboxes, human accelerated regions (HARs), the GO “Forebrain development” list, transcription factors in general, genes upregulated in a mouse DCX mutant brain, GWAS autism results, and, perhaps most interestingly, genes that are downregulated in the mouse embryonic brain when two ultraconserved regions are knocked out. Just plug the above database ID into our Fisher tool for a complete list of results.

More on transcription factors shortly. More on ultraconserved DNA later.


*My own crazy hypothesis: there is little or no fitness conferred by these sequences, at least on the part of the host organism. Instead, cells will kill themselves if two ultraconserved sequences fail to match perfectly. Here, we’re talking about selfish DNA. How are the two sequences compared for mutations? How is apoptosis triggered? That would be worth investigating.

whatismygene.com 


Wednesday, June 8, 2022

Transcripts that are and are not Perturbed in Cancer

We have nearly 2500 transcript sets derived from about 1200 studies involving cancer in human patients. Given this plethora, we’re equipped to ask questions like, “Which genes are rarely perturbed in cancer?” We did that. The underlying idea is that if a transcript is not upregulated or downregulated in cancer, there’s always the possibility that perturbing that transcript would have anti-cancer effects.

Specifically, we calculated the frequencies of all transcripts in our database in studies with human cells. We then repeated the operation, this time with the additional requirement that the cells must be derived from cancer tissue (NOT cell lines!). We can then use the binomial distribution to calculate the odds that particular genes would be randomly over/under-represented in the cancer set versus the larger set.

Jumping right into it, here are the first 25 transcripts that are rarely perturbed:

GADD45A

CHAC1

IFIT2

DDIT3

HBEGF

OASL

MAFF

TXNIP

ID2

INSIG1

IFIT3

PPP1R15A

MX2

ARRDC4

DDX58

NFKBIA

IFIT5

IFIT1

ATF3

DUSP5

ETS1

HMOX1

HERC5

CDKN1A

You may notice that the list is strongly overloaded with genes involved in the innate immune response. All transcripts are significant at a level no larger than P = 10-60. The champion, GADD45A appeared 632 times in the larger set, but only 6 times in the cancer set. Cancer hates the innate immune response; one big problem, of course, is inducing the response specifically in cancer cells.

Genes that were never perturbed (not even once) include:

ULK1

MYD88

LGALS9B

CPOX

PPP3CB

GRWD1

PPM1B

DEFA1

ZFYVE26

KIFAP3

PCTP

DCLRE1C

LPPR2

KIAA0355

C9orf47

All of these transcripts were at least as significant as P = 10-30. Though these significances can’t compete with those in the first, more inclusive list above, bear in mind that these are relatively rare transcripts, meaning that it’s difficult to derive extreme significances in these cases. ULK1 appeared 176 times in the larger set, but not once in the cancer set. The protein, a kinase, is involved in autophagy. 

We can also ask, “Which genes are most commonly perturbed in cancer?” This is a bit more mundane, but here are the first 25 genes in the list:

AGR3

ADH1B

DPT

COL10A1

MMP11

PIGR

MYH11

SFRP4

MMP12

ABCA8

C7

OGN

CDH3

SFRP2

COMP

ESR1

FDCSP

NAP1

ASPN

CXCL17

GABRP

THBS2

COL11A1

CYP2B7P

CXCL14

ADH1C

AGR3 appeared 93 times in the cancer set, but only 239 times in the larger set (adjusting for the size of the sets, you could say AGR3 appeared 1182 times in the cancer set). All of the above transcripts were significant at a level no greater than P = 10-79. The transcripts commonly appear in “cancer vs adjacent tissue” studies; nothing surprising there. It may be a surprise, however, to observe that the perturbation leans fairly strongly in the direction of downregulation in cancer, versus upregulation.

We can, of course, further divide the sets. For example, we can restrict the two datasets (cancer and non-cancer) to transcripts that are upregulated, as opposed to downregulated. Here are transcripts that are rarely upregulated:

DDIT3

CREBRF

DDX58

CDKN1A

GADD45A

IFIT2

HBEGF

CHAC1

TXNIP

ATF3

MAFF

IFIT5

HERC5

ID2

YPEL3

OASL

GABARAPL1

HMOX1

PPP1R15A

TRIM21

BCL6

MX2

NFKBIA

PARP9

IFIT3

Not surprisingly, the list strongly overlaps with the initial “rarely perturbed in cancer” list. The same applies for the list of transcripts which are rarely downregulated in cancer, which we won’t bother listing here. We will, however, note that plugging these rarely downregulated transcripts into our Fisher app, and selecting "Dominant Tissue" in the "Cell Type" box, we find that this list is strongly enriched (P = 10-12 ) with epithelial cell types, meaning that some degree of specificity can be obtained by targeting some of these genes for downregulation. In various studies, these rarely-down-in-cancer/epithelial-dominant transcripts can be downregulated by stat1 knockdown, resveratrol treatment, klhl23 knockdown, carboplatin treatment, top1 knockdown, and much more.

Transcripts that are rarely upregulated are also rarely downregulated (P = 10-25). The list of 33 transcripts found at the intersection of these two sets includes innate immune response factors (e.g. ifit1/2/3, oasl, mx2).That’s a bit of an odd result; why would cancer not downregulate the transcripts it works so hard to avoid upregulating? We should note a possible weakness in our approach; the large list of perturbed transcripts against which the cancer set was compared was heavy with cell lines (while, of course, our “cancer tissue” data is not derived from cell lines). The larger set also contains infection studies; infections almost inevitably result in an innate immune response. There may be other weaknesses that we’re not aware of. Nevertheless, we note that our “commonly up/down-regulated in cancer” lists overlap strongly with our “commonly up/down-regulated in cancer vs adjacent tissue” lists (with P-values less than 10-110 for both up and down). The “cancer vs adjacent” lists, of course, do not suffer from any of the aforementioned weaknesses*.

The database IDs for the aforementioned lists are as follows:

transcripts rarely perturbed in human cancer:  143176203

transcripts commonly perturbed in human cancer: 143177203

transcripts rarely upregulated in human cancer:  143178203

transcripts commonly upregulated in human cancer:  143179203

transcripts rarely downregulated in human cancer:  143180203

transcripts commonly downregulated in human cancer:  143181203


*So…why not look for rarely perturbed genes in “cancer vs adjacent” studies? We can do that in the future, but here we wanted the statistical power that comes from tinkering with huge datasets.

whatismygene.com 


Friday, March 11, 2022

An Odd Result

After adding gene lists to the database, it's important to test these new lists against all other lists in the database via Fisher's exact test. This helps us spot potential errors. For example, it's possible we've already entered the data into the database; the new study is re-using data from another study. Let's say the new study examines interferon effects on a cell line; if the up-regulation results mirror the down-regulation results from myriad other IFN studies, there's likely some error involving +/- signs or labeling of data. These errors could be generated on our side, but they definitely can also be generated by the folks who do the wet lab work and initial data generation.

Here's another kind of error. We grab a list of genes that are most commonly mutated in cancer (Mutational landscape and significance across 12 major cancer types, table s2). Running the list against all other lists in the database, we see that proteins with high molecular weights intersect with high significance. This signals an error of sorts. Long genes simply have more opportunity to be mutated than short genes. It makes sense, then, to adjust the mutation list by molecular weight. We do that.

We then run the adjusted list of commonly mutated cancer genes against our database again. The results, for the most part, make sense. For example, hypomethylated genes in lung cancer match up nicely with the mutation list (log(P)=-44); one can imagine that if a cancer wishes to target a gene, it could alter methylation patterns or mutate it (or, perhaps, the mutation itself alters the methylation pattern). Hypomethylated genes in other cancer types also match up with those in the mutation list. An independent list of genes mutated in ampullary carcinomas intersects nicely; no surprise. The same goes for a study of mutations in glioma. And so on.

The lung cancer hypomethylation list generates the second most significant intersection against the cancer mutation list. What's the most significant gene set? It's a GO list: GOMF_OLFACTORY_RECEPTOR_ACTIVITY, with a log P-value of -74. We'd list the intersecting genes, all 111 of them, here, but it's simply a tedious list of olfactory receptor genes (e.g. ORF5F1). Our GOMF_OLFACTORY_RECEPTOR_ACTIVITY list is "background-adjusted" (see here), so there's no concern that the list is strongly biased toward abundant genes. In fact, these receptors, not surprisingly, are fairly rare over most human tissues.

Despite the massive overweighting of olfactory receptors in the adjusted cancer mutation lists, TP53 still reigns supreme as the single most commonly mutated cancer gene. In fact, after adjustment, it's about 3X more commonly mutated than the next gene on the list, KRAS. The most commonly mutated olfactory receptor would be OR2T33, which ranks 21rst on the list. For what it's worth, it's a moderate sized protein (32kd).

There are indeed scholarly works on the subject of olfactory genes in cancer. Most, if not all, of these papers, however, focus on altered expression of olfactory receptors, not the tendency of these genes to be mutated.

So, let me ask blog readers: What the hell is going on here?

Here's one (flawed) explanation which should be nipped in the bud: there are a huge number of olfactory receptors in the human proteome. Therefore, any random selection of proteins is going to strongly overlap with a devoted list of olfactory receptors. According to Wikipedia, there are about 800 ORs in the human proteome; roughly 3% of the proteome. But of the 499 genes in our adjusted cancer mutation list, 111 are ORs; a whopping 22%. Another test is simply to pull a random selection of proteins and run Fisher's exact test against all lists in our database; the exercise can be repeated, Monte-Carlo style. We did that, and there's actually a slightly negative correlation between these random selections (out of 19,000 proteins) and the olfactory receptor list.

**************
Mar 15, 2022: To get some clarity on the question, I examined several TCGA tissue-specific mutation lists, applying the above adjustment for molecular weight. As with the data mentioned above, without the adjustment, TTN (Titin, the largest human protein) appears to be the most mutant entity in cancer; with adjustment, genes like TP53 and KRAS are inevitably found near the top of the list. However, these new lists are not overloaded with olfactory receptors. I still don't know what is going on, but the inability to reproduce the result dims my enthusiasm for the OR-mutation/cancer connection. Despite the absence of ORs in these lists, they still tend to intersect nicely with the above list (with log(P-values) around -20 or better).

For what it's worth, I note that there's a very noticeable tendency to find an arginine mutation in a well-conserved "DRY" sequence around position 122 (or thereabouts...the N-terminal leader sequence varies from OR to OR). 

One interesting tendency in many of the lists above is for the mutant proteins to be found in chromosomal regions that are absent of other genes. Specifically, no other genes are found within 200,000 bases of these frequently-mutated genes. However, this pattern is not consistent across cancers; colon cancer and urothelial carcinoma intersect strongly with these "nomad" genes (log(P) about -20), while breast cancer and glioblastoma show insignificant intersection.

June 1, 2022: Apparently, some programs may simply discard olfactory receptors as having driver roles in cancer. From NCG 4.0: The network of cancer genes in the era of massive mutational screenings of cancer genomes:  

Despite all efforts to refine the identification of driver mutations, current approaches are still prone to false positives, i.e. mutated genes that are erroneously identified as cancer drivers. For example, genes encoding olfactory receptors are often included in the list of candidates, because they tend to mutate although the biological function and expression pattern of these genes strongly dismiss a possible functional role in the disease. Similarly, overly long genes are also probable false positives because their recurrent mutations in several samples are most likely due to their length more than to their function.

Regarding this "tendency to mutate", the assertion is based on a 2013 paper. My own admittedly cursory search for chromosomal regions with a tendency to mutate in healthy tissue, based on table S2 in Whole genome DNA sequencing provides an atlas of somatic mutagenesis in healthy human cells and identifies a tumor-prone cell type, does not reveal any excess tendency for olfactory receptors to mutate. The mutation analysis program from this work, MutSigCV, makes adjustments to candidate cancer drivers based on frequencies of synonymous mutations and non-coding mutations in a sample's chromosomal regions. Further...

Because in most cases these data are too sparse to obtain accurate estimates, we increased accuracy by pooling data from other genes with similar properties (for example, replication time, expression level).

Genes that tend to replicate late in a cycle are apparently more likely to mutate. Is this really true for the hundreds of olfactory receptors in the human genome? There's also a general tendency for genes with low expression to mutate, at least in this particular paper.

In general, isn't it a bit presumptuous to offhandedly dismiss olfactory receptor mutations as potential cancer drivers? There may yet be other reasons why olfactory receptors are mutated in some cancer datasets and not in others.


whatismygene.com 


A Couple Potentially Useful Tweaks

First, a quick note to WIMG users: I'll be disappearing into the Himalayas for 2 months or so. Forgive the absence of new posts, database updates, and responses to your e-mails.

*********

We've made a couple additions to the "Cell Type" filter that can be applied in most of our apps.

First, you'll see a "Dominant Tissue" choice. What does that mean? A number of big science studies (e.g. A deep proteome and transcriptome abundance atlas of 29 healthy human tissues) have attempted to delineate proteomes/transcriptomes across whole organisms. Such studies allow one to ask, "what genes are expressed uniquely in a particular tissue (versus other tissues)?" We've combed through these studies to find these genes. Thus, for example, the gene MAGEE2 is expressed near exclusively in nerve tissue.

Knowledge of a gene's tissue-uniqueness is potentially useful for at least two purposes, we think. First, if you see an abundance of, say, appendix-unique genes in the blood, perhaps there's some leakage from the appendix. We've indeed noticed an enrichment for appendix transcripts in septic blood in some studies. Unexpected levels of particular genes could also indicate sample contamination. Secondly, tissue-unique genes could be excellent drug targets in some cases. You can place current drug treatments at some point between two extremes. At one extreme, a very general sort of treatment would have an equal effect on all cells in the body. At the other end, you have modern personalized medicine approaches that only target very specific cells (e.g. neoantigen vaccines against cancer). In the middle, or perhaps toward the "specialized" end of the spectrum, you could have treatments that only target specific organs or cell types. If a gene is both lung-unique and necessary in lung cancer, one could target that gene without effects on other organs.

The most obvious use of this feature is with the "Fisher" or "Match Studies" apps. Let's say you have a list of blood transcripts. Plug them into the Fisher app and select "Dominant Tissue" in the "Cell Type" filter (left side of the screen, black background). Submit. You'll receive information about the various tissue types found within the blood sample. Of course, if the blood is absolutely "pure", you won't get any interesting output...perhaps you'll find that the blood is enriched with blood-only transcripts, which is not particularly exciting. In any case, you probably won't see extreme P-values in the list; some of the "tissue dominant" lists in our database are fairly short, simply because tissue-unique transcripts/protein are not common. The shortness of these lists limits the possibility of seeing crazy P-values.

Bear in mind that the output is only as good as the tissue-dominant lists we've constructed. As seen above, one of the studies we draw upon is a deep analysis of 29 human tissues. In this case, we base "uniqueness" on the fact that particular transcripts were seen in only one of the 29 tissues. There are, of course, more than 29 tissues in the human body, so it's possible that a transcript we've labeled as "tissue-unique" could be found in a tissue (say, tissue #30) that was not examined in the study. One can also question whether some transcripts/proteins would be so unique under perturbation (e.g. cancer, infection, drug treatment, etc), as the underlying studies focus primarily on healthy, equilibrium tissues.

The second addition to choices under the "Cell Type" filter involves blood. You could select "blood" or "blood plus." Mere "blood" will eliminate all studies not involving whole blood, or large fractions of blood. "Blood plus", however, includes studies involving all the sorts of cells that are expected to be found in blood; macrophages, lymphocytes, mast cells, monocytes, erythrocytes, blood stem cells, as well as whole blood. If you're examining the blood transcriptome, you may find this minor alteration to be of use.


whatismygene.com 


Thursday, March 10, 2022

What's Up and Down in Lung Cancer?

Pulling data from 11 lung cancer studies, we've assembled a list of transcripts that are commonly up- and down-regulated in lung cancer. The PMID IDs for these studies are 33801812, 32649874, 30389658, 30177858, 29127420, 27669169, 27354471, 27093186, 26483346, and 25429762 (that's 10...we extracted two sub-studies from 3380182). The database IDs for these up- and down-regulation lists are 141048203 and 141049203.

On the side of up-regulation, ube2t leads the pack, appearing in 8 out of 11 of the upregulation lists. Given the small size of our lists (typically about 200 genes), that's fairly impressive. A bit of googling reveals this gene is indeed implicated in lung cancer. At least one paper describes the development of a ube2t inhibitor, though this drug was injected in stomach tumors in mice. Genes up-regulated 7 times include anln, depdc1b, aspm, nek2, cenpf, stil, top2a, prom2, c16orf59, and melk. In general, the list is heavy with cell-cycle regulators. Wikipedia points out that given melk's abundance in cancers, attempts have been made to inhibit it; however, a crispr study casts doubt on melk's necessity in cancers. Perhaps melk is just along for the ride in a swarm of cell-cycle-related transcripts. Plugging melk into our co-expression app, that seems to be the case, with prominent cell cycle regulators like top2a, cdk1, aurkb, and more swarming alongside melk with extreme significance.* 

Going one step further, we can plug the list of melk-coexpressed genes into our Fisher app. There, relevance to the cell cycle is obvious. For example, genes downregulated in a myeloma line on cdk4/6 inhibition overlap the melk-coexpression list with a log(P-value) of -133. Genes upregulated in S phase vs G1 phase in fibroblasts overlap with a value of -130. Etc. Thus we see how melk can be prominently upregulated in lung cancer without being a necessity. 

To complicate matters, we plugged melk into the Regulation app. We have three studies in which melk was specifically targeted (one drug study, two knockdown studies). In the drug study, melk inhibition strongly downregulates (log(P) = -25) the genes with which melk swarms, while this effect was not seen in the two knockdown studies. We note that the drug study involved glioma stem cells.

Looking at down-regulation, the presence of ca4, carbonic anhydrase, in the list is quite impressive; 9 appearances in the 11 studies. There are papers on the role of ca4 in cancer, though there's not a high level of enthusiasm for developing ca4-agonists as cancer therapies. Entering the gene in our "Relevant Studies" app, we see two studies in which dexamethasone seems to do a nice job of upregulating ca4. Then again, we see a paper showing a positive link with lung cancer dexamethasone treatment and metastasis. Studies where primary cancer treatment apparently enhances the transcriptome you'd expect in metastasis are common in our database; perhaps we should do a deep dive on this subject. It's not as if an inverse correlation between primary cancer treatment and metastasis has not been noted; look here.

Genes appearing 8 times in the down-regulation list include fmo2, cav1, tcf21, fam107a, and rage.

Plugging the lung cancer up/down-regulation lists into the "Match Studies" app and selecting "inverse correlations" to search for means by which the lung cancer transcriptome could be reversed, the most prominent result is a mouse study in which the thymus transcriptome was altered via full body radiation (log(P) = -206).  A study involving bmp2 treatment of MSCs ranks second (-186). Restricting "cell type" to lungs, the best lung-cancer reverser involves a MAPK inhibitor (see here). Not surprisingly, the treatment targets the cell cycle. Studies involving lactoferrin, erlotinib, etoposide, and more figure prominently in the list of lung cancer reversers, at least at the cell-line level.

*In fact, in some cases the significance is so extreme that our app won't output a log(P-value). It seems that P values below about 10^-320 don't get output, resulting in blank cells in our "log10 binomials" column. We're not particularly motivated to find a workaround for this issue, as we'd say that 10^-320 is pretty damn significant.

whatismygene.com 


Friday, February 11, 2022

What's in Our Database?

Recently, we exceeded 40,000 gene lists in our database. At some point in the (not-so-near) future, we'll upgrade the very basic appearance of our site. However, the majority of our labor has been, and will be, focused on the underlying database. More lists means more opportunities for the user to find studies that strongly intersect with his/her own lists. It means more chances to find genes that are significantly co-expressed with the user's own genes of interest. Etc.

40,000 lists means approximately 800,000,000 study/study intersections, each with an associated P-value. When we break the 50,000 mark, we'll have about 1,250,000,000 intersections. Here, a 25% increase in database size means greater than 50% more P-values. For biological truthseekers and hypothesis-generators, database size should be critical, not a pretty interface.

We'd also point out that, with few exceptions, our database is not littered with recycled GO lists and the like. Most of our lists will not be found elsewhere. Sometimes I get the feeling that a large portion of gene enrichment tools are generated by folks whose primary interest is in programming and computer science, not biology. The database content is thus an annoyance that must be dealt with. The easy solution to this annoyance is to grab existing GO lists and manufacture some new, tricky algorithms that make the tool worthy of an NAR paper.

So, what's in the February 2022 incarnation of the database? First, let's look at the species breakdown:


Currently, we do not include drosophila or zebrafish studies in the database. There are plenty of these studies out there...perhaps we'll branch out into flies and fish in the future.

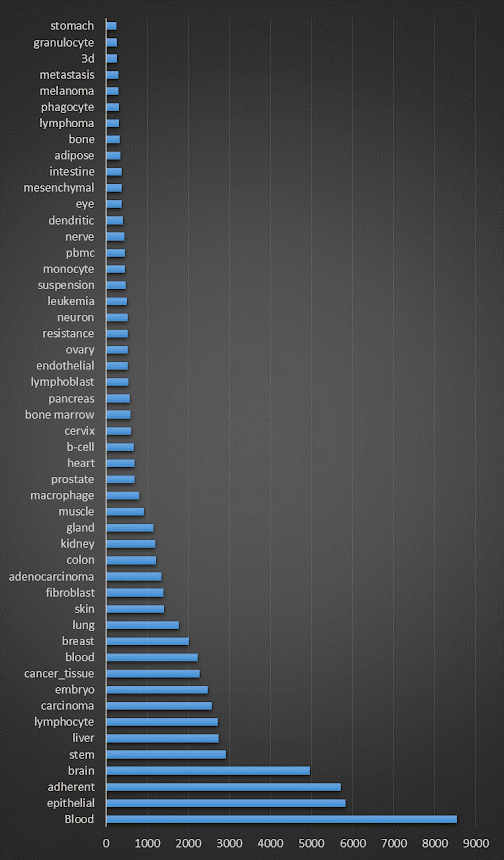
Next, how about tissue types?


Above you'll see the most common 50 terms in the database. In actuality, there are about 250.

The most common tissue in the database is "Blood", with a big "B". The big B means that any cell types that could be found in blood are included...lymphocytes, granulocytes, red blood cells, etc. You'll also find the term "lymphocyte" in the graph. This explains why, if you were to sum up all the tissue counts above, there'd be well over 40,000 terms. A small b "blood" includes only major blood fractions (e.g. whole blood, plasma, etc.). Look here for more information on the cell types you'll find in the database.

How about the sorts of molecules you'll find in the database? Here, 83% of the database falls under the term "transcript." This 83% will dominate any graph that we make, so below we list the other sorts of molecules in the database.


In the case of the terms "PTM", "methylation", "antigen", "chip", and "epitranscriptome", we list the genes associated with these events. Some would dispute the inclusion of such studies within our database. A hypermethylation event, of course, has a very specific location. A nearby location on the same gene could be hypomethylated, meaning that this gene could be found in both hyper- and hypo-methylation lists from a single study. We justify this approach with the simple observation that two hypermethylation lists from different studies may overlap very significantly (try it: find a list of hypermethylated genes in a particular cancer type and enter it into our Fisher tool...don't bother selecting any options under the "molecule" filter).

We've become a bit disinterested in circRNA studies of late. The vast majority are focused on cancer, to the exclusion of other diseases, knockouts, etc. If we were to find that the circRNAs upregulated in a particular knockout study coincided with circRNAs that are downregulated in pancreatic cancer, for example, that would be quite interesting. But given the trend in the field, such comparisons aren't possible.

Finally, how about study types?

"Treatment" refers primarily to application of large molecules to cells (as opposed to overexpression, where expression occurs inside cells, or "drug", which refers to small molecules). "Environment" is a broad term that covers, for example, dieting studies, lifestyle studies (e.g. exercise vs sedentary), as well as surgeries. "PPI" refers to protein-protein interactions.

Our database will continue to grow. However, it's unlikely that the proportions shown in the above graphs will change much in the future.


whatismygene.com 


Monday, December 20, 2021

More on Cytokine Storms

Previously, we described the construction of our lists of genes that are up/down-regulated upon a “cytokine storm.” We also have a list of cytokines and cytokine receptors (dbase ID 118764101), composed of 178 different genes. Intersecting the “upregulated in a cytokine storm” list with the “cytokines and cytokine receptors” list, we only find 7 genes in common (ccl20, il1r1, il1r2, il18r1, il8, tnf, and pglyrp1); four receptors and just three actual cytokines. One cytokine, ccl5, was actually downregulated during a cytokine storm. One could be pedantic and claim that if it doesn’t involve cytokines, it’s not a cytokine storm. Or…we did a shoddy job of constructing lists that are supposed to exemplify cytokine storms.

However, you might find that our cytokine storm lists actually do a fine job of capturing the events behind a deadly infection. How might you know? Currently, our “Match Studies” tool is pre-loaded with the up/down cytokine storm lists. Simply hitting “submit”, the output you’ll see will be studies that match up with cytokine storms. Ignoring the studies from which the lists are actually derived, we still see studies involving Kawasaki disease, septic shock, pneumococcal disease, lupus, dengue infection, and more…the cytokine storm lists match up quite nicely with the nastiest forms of immune over-reaction.

Taking the validity of our lists for granted, we can ask, “How might one reverse a cytokine storm?” Here, all you need to do is click the “Inverse Correlations” box in the “Match Studies” tool. This will search for studies in which the genes found in the “upregulated in cytokine storms” list are downregulated, and the genes in the “downregulated in cytokine storms” list are upregulated.

This is where we toot our own horn a bit. The current standard of care for a Covid-19 cytokine storm is treatment with Tocilizumab. Sure enough, a study involving Tocilizumab is rated the 10th best “reverser” of cytokine storms, and second-best if one selects “Treatment”* under the “Experiment Type” filter.

There are, however, other cytokine storm reversers that appear more potent than Tocilizumab, at least by our rating system. Infliximab ranks higher, and there is at least one study that has examined this antibody, with interesting results, for Covid-19 treatment. A study involving proprionic acid (for Multiple Sclerosis) also evinced strong reversal of cytokine storm genes, though we don’t see Covid-19-related research. Rosuvastatin is another reverser, and a quick Google Scholar search shows that statin use may indeed be associated with decreased Covid-19 mortality. The same goes for JAK inhibitors, which rank highly as cytokine-storm reversers. The list goes on.

Actually, the single strongest reverser of a canonical cytokine storm involved an antibiotic course. Note, however, that the study involved treatment for mycobacterium-related ulcers over 90 days. One shouldn’t expect that antibiotics would reverse a cytokine storm, especially over a short time period. On the other hand, the history of drug-discovery is, of course, rife with examples of the discovery of effective drugs with unexpected mechanisms of action.

How about DIY cytokine-storm reversal? With the obligatory warning that preventative and acute treatments may be diametrically opposed, a notion very much lost on the general public, the answer may not be surprising: Vitamin D. Specifically, results obtained in a 100-subject 2017 study suggest that Vitamin D supplementation reverses the transcriptomics of cytokine storms. Note, however, that the study involved year-long courses of supplementation! Be that as it may, yet another vitamin D study showed a similar reversal. A study involving an agaricus mushroom supplement also reversed our cytokine storm genes**. For more results, check out our tools and have at it!


*We discriminate between “treatment” and “drug” experiments in our database. A treatment would involve a protein, or another sort of large molecule, while a drug would be small. Treatments might also involve a mixture of molecules; a study in which serum was applied (vs withheld) to cell culture would be an example.

**A little searching shows that some mushrooms, agaricus included, have high Vitamin D levels.


whatismygene.com 


Mixing WIMG and AI

We've been tinkering with incorporating AI (Gemini) with our Fisher app. The idea is not so tricky...you feed the AI an identity/ruleboo...