Tuesday, February 7, 2023

Another Data Dump

Here's a massive new mass-spec-based screen of drug effects: Proteome-Wide Atlas of Drug Mechanism of Action. 875 drugs were tested in the hct116 (colon cancer) line, and there wasn't any compromising on sensitivity in the name of efficiency or budget; about 7700 proteins were detected for each of the 875 perturbations. 

Another nice feature of the study is the fact that most of the 875 drugs were chosen to have very specific, as opposed to broad, targets. Thus, you can ask questions like "How does BACE1 inhibition compare to BACE1 knockdown?"

Needless to say, we entered all the results in our database. 875 tests, each with up- and down-regulated portions, adds 1750 gene lists to the database. Data was entered simply on the basis of fold-change. Each list contains 100 up- or down-regulated proteins. If, for some reason, you wish to search these 1750 lists exclusively, just paste "proteome-wide atlas of drug mechanism of action" (no quotes) into the "keyword" box in the WIMG tool of your choice. Using the "relevant studies" tool, for example, we found 10 drugs that altered CDK4 protein levels (5 up, and 5 down, coincidentally) in the study.

These sorts of data dumps make our tools all the more powerful. There's more chance that some insight will be generated when you search against an outrageous variety of studies. Unfortunately, the speed of output decreases as the database grows larger. Hopefully, processing power on our server will increase in step with the size of the database. If you find yourself getting antsy while waiting for output, we suggest you use our filters liberally. In particular, the "Restrict IDs" and "Emphasize Internal Significance" filters can decrease processing time substantially.


whatismygene.com 

Tuesday, December 20, 2022

Your Christmas Gift: More GO lists

We've added more than 1,000 GO lists to our database. There are thousands and thousands more we could add, if we were motivated. The lists we added are "core" lists, i.e. the lists from which other, larger, lists are built up. If your input list doesn't match up with at least one of the GO lists in our database, we're guessing it won't really match up with ANY GO lists out there. By "really", we mean that it's always possible to assume unrealistic background figures for the input set, the GO list, or both, thus generating artificially significant P-values. All of the WIMG GO lists are adjusted for background.

In addition to the "coreness" of the lists we added, we also required that the lists contain at least 40 genes. This is simply because our background-estimation procedure generally becomes more imprecise as the size of the list grows smaller.

After adding an experiment-based list (e.g. a set of genes upregulated upon IFNA treatment in a specific study), we always perform Fisher's exact test of new list against all other lists in our database, generating as many as 95,000 P-values. Part of the reason for this testing is to check for possible errors; if two lists overlap at P = 10^-400, perhaps they actually come from the same experiment; it's not necessarily cheating to use the same data in two or more studies. On the other hand, perhaps some researchers are indeed plagiarizing data. Another reason for testing new data is simple curiosity. In the course of this testing, we note that it's rare to see GO lists appear as the absolute most significant match to any particular study. Most likely, an IFNA treatment list will match up to another IFN study, or a viral infection study, not a GO list. The best-matching GO list, in fact, may be found below hundreds or even thousands of better-matching experimental lists. It's interesting to note, however, that this is not always the case. For example, examining genes upregulated in atrial appendages of old vs young individuals (GSE136928), GO lists emerged as the most significant matches ("GO:0003823 antigen binding" took the top spot, with a P-value of 10^-22, with numerous other GO lists following). 

In general, we believe that most diseases function by altering gene modules, not the convenient biological pathways that GO lists are about. An alteration in a single pathway isn't the difference between brain cells and heart cells. My own thinking is that organisms are freaky-paranoid about the possibility of being hacked by viruses or bacteria or even cancer; complexity that may seem unnecessary reduces the possibility of hacking. There aren't many absolutes in biology, however; sometimes GO lists do a pretty good job of informing you what's going on.


whatismygene.com 


Monday, November 28, 2022

HDAC Inhibitors

We haven't posted for nearly 3 months. That's not for lack of activity; we're writing a paper! That means we're doubling our efforts to load the database with studies. Right now we have about 52,000 gene lists from 25,000 studies. The gene list total jumps to 92,000 if we include a massive perturb-seq study.

We note an abundance of studies involving HDAC inhibition. There are 11 different histone deacetylases in the human proteome, falling into 4 classes. Particular HDAC inhibitors, often used in cancer treatment, can inhibit a single HDAC (e.g. HDAC1), several, or all. Despite these variations, we note that the transcriptomic effects of HDAC inhibition seem to be somewhat stereotyped. We thus clumped the results of 59 inhibition studies into "WIMG up-regulated on hdac inhibition" and "WIMG down-regulated on hdac inhibition" lists with database IDs 150844207 and 150845207. Bearing in mind that our gene lists tend to contain about 200 IDs, the stereotyped nature of HDAC inhibition is seen in the fact that, despite an array of about 15 different inhibitors, the gene DHRS2 was upregulated in 28 studies, while LANCL2, a glutathione transferase, was downregulated in 32. Neither of these genes has been targeted in big-data fashion.

More recognizable names upregulated on HDAC inhibition include HSPA2, MAPT, KIF5C, and FOS. On the downregulation side, we have KEAP1, ATF5, CREBBP, U2AF2, SMARCB1, FOXM1, MCM7, and XBP1. All of these appeared in at least 13 of the 59 studies. Here, "recognizability" is not scientifically defined...it's about me eyeballing the gene lists. 

Using our "Match Studies" app, we can say the following:

*Emulating HDAC inhibition via knockdown is accomplished by targeting rfwd3, followed by fis1 and grem1. The best way to reverse hdac inhibition via knockdown would be by targeting foxd3. It's interesting to note that specific HDAC knockdown studies aren't prominent in the list of knockdown studies that parallel HDAC inhibition. This is possibly because nobody performs pan-HDAC knockdowns (at least 11 siRNAs required). Another answer is simply that inhibition and knockdown are different experiments; in the case of inhibition, HDAC levels may remain unperturbed, interacting with various protein partners as usual; that's not the case with knockdown.

*Utilizing knockout, pom121 ko does a fine job of acting as an HDAC inhibitor. We don't see any knockout studies that strongly reverse the HDAC inhibition signature. Again, HDAC knockout studies don't strongly mimic HDAC inhibition.

*Perhaps oddly, the overexpression study that best emulates HDAC inhibition involved overexpression of noncoding retrotransposon line-1 sequences. The underlying study makes no mention of hdac inhibition.

*HDAC-inhibition, or reversal thereof, does not seem to be a phenomenon associated with infection; of more than a thousand infection studies in our database, none showed the signature of HDAC inhibition (or reversal). In fact, these inhibitors neither paralleled or reversed any diseases in particular. We do note, however, that disease signatures weakly reversed by HDAC inhibition were definitely enriched in cancer studies...melanoma, neuroectodermal tumors, cervical carcinoma, etc.

*HDAC inhibition is associated with cell stages. For example, a study conducted with sh-sy5y cells showed the HDAC inhibition signature upon induction of differentiation.

Moving to the "Fisher" app, which doesn't require input of both up- and down-regulated portions of a study, we see that...

*Of our short catalog (about 200 entries) of GO lists, none of them fare well in capturing HDAC inhibition. On the side of up-regulation, GOBP_SISTER_CHROMATID_SEGREGATION seems to fare best, with an unadjusted -log(P) = 4.5. On the down-side, WP_G1_TO_S_CELL_CYCLE_CONTROL comes in with -log(P) = 3.9. Bear in mind that we apply "background-adjustment" to these lists...the P-values would certainly be higher otherwise. The above GOBP_SISTER_CHROMATID_SEGREGATION list placed second (-log(P) =3.6) on the down-side, pointing out another weakness of many (not all) of these sorts of gene lists.

*Resveratrol does a decent job of mimicking HDAC inhibition.

*Genes upregulated on HDAC inhibition overlap nicely with our "WIMG transcripts most rarely up-regulated in human cancer" list (-log(P) = 7.9), while genes downregulated on HDAC inhibition overlap with "WIMG transcripts most commonly up-regulated in human cancer" (-log(P) = 9.5), making a nice case for the use of HDAC inhibitors in cancer.

The "Third Set" app also allows users to input lists of genes. However, the two lists must intersect to some extent, which is not the case here.

Other WIMG apps require the input of only one or two gene names, as opposed to lists, meaning that entry of the above two lists would not be fruitful. We can, however, make guesses as to the functions of the aforementioned two genes, DHRS2 and LANCL2, with the co-expression app. This way, we see that histone genes like HIST1H2BJ and H1F0 are strongly associated with DHRS2. Interestingly, quite a few lncrnas (e.g. linc00624) associate with DHRS2. Regarding LANCL2, DUS3L, a trna modification enzyme, is most strongly associated (-log(P) = 26). Going a step further, we grab the full lists of genes co-expressed with DHRS2 and LANCL2, and enter them into the Fisher app. This way, we see that DHRS2 associates with genes that are commonly perturbed in epithelial cells, genes upregulated following radiation treatment, genes upregulated on ERG knockdown and, not surprisingly, genes upregulated in a variety of studies involving HDAC inhibition. LANCL2 associates even more strongly with genes involved (on the side of downregulation) in HDAC inhibition. Ignoring these sorts of studies, we again see involvement with radiotherapy. 

The "Cell Type" app informs us the DHRS2 is often perturbed in adenocarcinoma studies (which could involve either cell lines or actual cancer tissue; you could filter out the cell lines, if desired). The gene is rarely perturbed in blood or brain. LANCL2 is far less significantly associated with particular cell types. One possible reason for this is simply that LANCL2 only appears 200 times in the database, making it difficult to show that this gene is strongly associated with particular cell types. The trend is for the gene to be perturbed in the brain, and unperturbed in cancer tissue.

We should point out that the above "experiments" can be performed by any WIMG user using the 150844207 and 150845207 database IDs. The level of detail, of course, will far exceed the above summary of the effects of HDAC inhibition.


whatismygene.com 

Saturday, August 13, 2022

Thinking about ORA and FCS

There are quite a few papers out there on the subject of gene enrichment, comparing various methods. The two most common methods out there are termed ORA (over-representation analysis) and FCS (functional class scoring). Without quibbling, WhatIsMyGene (WIMG) would be termed ORA: the user inputs a list of genes, which needn't be ranked, and a database is searched for the lists which most significantly match up with the input list. With FCS, the user can input a ranked list without needing to make a decision about where a cutoff must be made. You could even input the entire list of genes identified in your study, as long as you've ranked them according to some criteria.

A lot of papers suggest the FCS approach is superior. The main argument involves the arbitrariness of the ORA input list cutoff. Why toss all genes with P-values that are just a tad greater than 0.05? Even on this ORA-loving blog, we've questioned this practice, and routinely see very interesting results involving genes or gene lists that didn't meet the standard 0.05 cutoff for significance.

Now, let me quibble for a moment, and then continue with the main subject: in WIMG, ranking a user input list can be helpful. That's because 1) most of the lists in our database are ranked and 2) the user can select a desired length for these lists. In other words, you could choose to examine only the top 25 genes within all our ranked lists. See here for more details. If the genes at the top of your own list are indeed more important than those at the bottom, you'll note that you don't see any increase in significance when you choose the "top 100" vs the "top 25" option. Thus, to some extent, WIMG negates complaints about the arbitrariness of cutoffs in ORA. Ultimately, the important issue is whether the use of ORA vs FCS (or vice versa) screws up a biologist's chances of making an interesting observation, and I can't say I've seen compelling arguments either way. That's one reason why WIMG's prime focus is on the database side, not on development of tricky algorithms.*

To continue: I've previously blogged about problems with the usage of "Gene Ontology" (GO) lists (and their brethren, KEGG, Reactome, etc.; let's call them "GO-like"). WIMG attempts to alleviate these issues: see here. Basically, we find that many of these GO-like lists contain lists of genes that are strongly biased in terms of abundance. Your own gene list may have been drawn from a universe of 20,000 genes, but some GO-like lists appear to be drawn from a much smaller universe. This creates issues when you attempt to use Fisher's exact test (or hypergeometric or whatever), which requires you to have a decent idea of the joint background behind the two lists in question. GO-like lists don't come with backgrounds!**

A related question (or, perhaps, precisely the same question...I'm not clear) regarding GO-like lists is this: if you tag abundance figures on all the genes in a GO-like list, do these abundance figures conform to a normal curve?

So, ORA can spit out deceptive P-values when comparing your list against GO-like lists. Could FCS have similar issues?

Sure.

First, a crude understanding of the innards of FCS is useful. The basic algorithm is not horribly difficult, despite intimidating-looking equations in the underlying papers. There's your own ranked list, L, and a GO-like list, G. If the first gene in L is found in G, you write down a positive score (like +1, or +3.7, or whatever,). If not, write down a negative score (e.g. -1). Go to the second gene in L. If it's found in G, add to the score you just wrote down; otherwise, subtract from the previous score. Continue like this until you reach the bottom of L. If L intersects nicely with G, you'll reach a peak score value, after which the score begins to decline. If L doesn't intersect with G, you'll just get a zig-zag line or a steady decline, instead of a mountain peak (or valley, if you're looking at downregulated genes in L). At this point, you want to assign a P-value to the result. This is done by randomly re-ranking the genes in your list and rescoring ad-nauseum. If there's an interesting match between L and G, there should be few or no occasions where random sorting results in a more significant score than the initial non-randomized score. The P-value comes from comparing the number of times you randomly derive a superior score against the number of times you performed the randomization. If I've got it right, you can also get a P-value by doing a Kolmogorov-Smirnov test for normality, and bypass the randomization step.

Now, let's imagine a case where L is drawn from a universe of 20,000 genes, but G is drawn from a universe of 2,000 genes. To my thinking, that means there could be 9 interesting genes in L for every one gene in G. Those 90% of genes, which could be very important (in cancer, for example), will subtract from the running score whenever seen. If, on the other hand, both L and G are drawn from the same universe of 2,000 genes, you'll get a much higher score and a more significant P-value. In other words, you get rewarded for entering lists of genes that are biased for abundance. You can tinker with this in Excel, using manufactured lists L and G; the "match" function is useful.

The above issue could be solved, I believe, by properly weighting the negative values. If L's background is 10X larger than G's, you could add 1 for a positive match, but subtract 0.1 for a non-match. In my own Excel tinkering, this seemed to work; you can get the same peak score for the 2000/2000 case as for the 20000/2000 case if you adjust the scoring system correctly. But nobody does this, of course. That's because, again, nobody (except us) assigns backgrounds to GO-like lists. Previously, we showed that it's not difficult to derive an approximate background for these lists.

One problem I see with FCS is the fact that the P-value is derived from a permutation test, meaning you'll never see extreme P-values (i.e. your computer will probably explode after, say, a quadrillion re-assortments of your gene list). Maybe I'm wrong, but I'm thinking Kolmogorov-Smirnov won't save you either...the test poops out for crazy P-values.*** When comparing 1,000 lists G to each other, you really do want an output where the absolute craziest P's are allowed to bubble to the top. Or, to put it another way, 10^100 is 10^75 times bigger than 10^25. Is that not important?

Another weakness of GO-like lists (unlike WIMG lists 😄) that we haven't addressed before is the fact that they're generally unranked. I would think that the FCS folks could find a way to make their approach all the more powerful by utilizing ranked G's, not just ranked L's. Again, though, it's a bit difficult to rank genes when you derive them by text-mining. If you ranked them merely by mentions, I'm guessing you'd find abundant genes strongly over-represented at the top of your lists. Nevertheless, even in a "concrete" list of genes like those involved in the Krebs cycle, some genes are more vulnerable to perturbation than others. Some are more dispensable than others. With some thought, ranking could be done.

A final issue (for now) with FCS is this: sometimes two lists don't intersect at all, and this is actually significant. This most often happens when G and L are large relative to the background (e.g. G=1000, L=1000, the background = 10000, and there's no intersection whatsoever between lists). I don't see FCS tools dealing with this potentially interesting prospect. Any tool that utilizes Fisher's exact test or the hypergeometric test, however, should be able to deal with this situation without a hitch.

At some point, we'll write a paper, making WIMG entirely "respectable." We'll need to show that we are, in some respects, better than other tools. My approach will not be math-dominant. Instead, it will be biology-dominant. What I mean here is this: if you insert a list of genes up-regulated in mouse brains when you apply drug X, will the output involve mice? Brains? Bonus points if the tool in question reflects back to you that you applied drug X. Such results give the user confidence that more "remote" results (e.g. genes upregulated in a human neural cell line on knockdown of gene ABC) that nevertheless intersect the mouse list with high significance are indeed relevant to whatever questions the biologist is asking.****

*Let's assume, for a second, that a paper comes out that convinces me of the superiority of FCS. It's really not a big deal. I can just add the vastly superior algorithm to the site. A good programmer (not me) could probably do this in a matter of hours or days, especially if an R package containing the nitty-gritty code is available. On the other hand, nobody is going to duplicate our underlying database in a short period of time. It's really big.

**Just to be clear, this problem is not solved by tools that ask you to enter the genes that comprise your background, in addition to your list L. The problem to which I refer lies on the side of the lists G, which have unknown backgrounds.

***I do note that GOrilla, a tool that'll use an FCS approach if you plug in a single list L (as opposed to the list L plus a background list B), can spit out P-values on the order of 10^-15 (I got that figure by grabbing a GO list and plugging it into the tool...it damn well better output a very nice P)*****. I'm not sure how that works. On the other hand, I was surprised to find that the online version of GSEA actually invokes a hypergeometric test, allowing for the crazy P-values that you may find. Why would the pioneers of FCS use the hypergeometric approach? It's probably because there's a lot of processing required. To perform a single L/G comparison, you've got to do a lot of re-assortment; the more the merrier if you're looking for extreme P-values. Then you move on to the next list G2, and repeat, and then G3, etc.

****Some folks might actually complain that the output reflects right back to you what you put in. In the case of WIMG, you can eliminate that complaint. You could, for example, require that only human lists are examined against your mouse list, or that only knockout studies are examined. Or, perhaps, the complainer wishes that only big, broad pathways that are presumably universal to all cell types are output...in that case you can choose the "external lists" within the "Cell Types" box on the left side of the page, and you'll only receive GO-like lists as output. Don't be disappointed in the not-so-significant P-values that may be generated, however...that's what happens when these lists are adjusted to account for backgrounds that are often quite small.

*****When we plug the same list into our own software, we get a P-value of 10^-96. Intuitively, what sort of P-value do you expect when two lists of about 100 elements and a background of 1000 happen to intersect perfectly?


whatismygene.com 

Friday, August 12, 2022

Transcripts that are and are not Perturbed in Cancer: Part 2

Previously, we examined transcripts that are and are not perturbed in cancer. This was done by comparing all cases where transcripts were up or down-regulated in cancer tissue against the entirety of non-cancer studies (that involve some sort of perturbation) in our database. Using this large non-cancer dataset, we can derive some very significant P-values, which we like. We did, however, mention some weaknesses with this approach and suggested a different approach for a future post. Here's the future post.

This time, we grabbed 160 studies that involved comparison of cancer tissue to adjacent, healthy tissue and looked for genes that were never/rarely upregulated or downregulated in cancer tissue. There are also weaknesses in this approach. The relatively small dataset means we won't see extreme P-values. Also, since every gene is perturbed in cancer in this dataset, in one direction or the other, we can't search for genes that are rarely perturbed at all (in both directions), as we did before. Finally, note that we only examine solid tissue cancers here, where a comparison between diseased and healthy tissue can be made.

Jumping into it, what are the genes that are rarely downregulated in cancer? TOP2A leads the list, being upregulated in 52 studies, and downregulated in only 2.  The P-value here is about 10^-14. Next up is COL1A1, which was upregulated 41 times, and never downregulated. ASPM, CTHRC1, MMP11, SPP1, CENPF, CDH3, CDKN3, and NEK2 follow.

This list of genes rarely downregulated in cancer (dbase ID 146502203, available on our next database update) corresponds nicely to genes that are most commonly up-regulated in cancer in the broader approach we used in our initial post: P = 10^-230. We also constructed a list of genes that were NEVER seen to be downregulated in the cancer vs adjacent studies we have on hand (dbase ID 146503205). Naturally, this list overlaps quite strongly with genes rarely downregulated in cancer (which includes the "nevers").

We'll examine possible treatment approaches that would downregulate the above genes in a future post. For now, we'll point out that well-known cancer treatments are prominent as downregulaters: cdk4/6 inhibitors, bromodomain inhibitors, mek1/2 inhibitors, etc. 

How about genes that are rarely upregulated in cancer (dbase ID 146503204)? Here, ADH1B leads the way, downregulated in 52 studies and upregulated in only 2 (which, coincidentally, is the exact opposite of the pattern we see with TOP2A). Next, we see ASPA, DPT, CFD, CXCL12, MT1M, ABCA8, FAM107A, ADH1C, and C7. ASPA is the first gene to never be upregulated in cancer, having 40 examples of downregulation without a single case of upregulation. Again, we also have a strongly overlapping list of genes that are never upregulated in cancer (146504206). And again, these new lists correspond very strongly (P<10^-200) to lists constructed using the broader approach.

Briefly, what are the treatments that might upregulate genes that are rarely upregulated in cancer? MAPK and tyrosine kinase inhibitors are seen, as well as BMP2 treatment, and IL17A antagonists. 

Are there "natural" or "lifestyle" approaches that might tend to downregulate genes upregulated in cancer? We'll look at that in the future. Initially, we're both relieved and disappointed that well-known cancer treatments come to the fore when we try, bioinformatically, to reverse cancer trends. Such a result strongly validates our approach, no? On the other hand, we'd be happy to see some less obvious approaches emerge. As we've mentioned before, treating the primary cancer may promote metastasis, while treating the metastasis may enhance primary cancer growth. Eyeballing the data, abetting metastasis seems to be more of a concern when upregulating genes that are downregulated in cancer (e.g. with MAPK inhibitors), rather than downregulating the upregulated genes.

We also generated a more obscure list (146504207). This time, we wanted to find genes that were seen to be upregulated in some studies, and downregulated in others. We required that no such genes be altered (up or down) with a P-value < .05, and that the gene be seen in at least 16 studies. AKR1B10 is the winner here, upregulated in 13 studies and downregulated in 14. IGFBP3, ANXA3, NNMT, AZGP1, TACSTD2, CXCL2, DACH1, NEBL and TDO2 follow. When we run this list, consisting of a mere 30 members, against all the lists in our database, nothing of significance emerges. Despite the weak significances, it does appear that studies involving drug resistance percolated to the top, and a quick Google search indeed reveals studies where some of the above genes are implicated in resistance. For example, AKR1B10 induces resistance to daunorubicin in at least one study. In addition to relevance to resistance, one could speculate that cancer types or cancer subsets could hinge on these sorts of genes: if IGFBP3 is upregulated, it might be worthwhile to downregulate it, and vice-versa.


whatismygene.com 

Friday, July 15, 2022

Perturb-Seq in Our Database

We've updated our database with data from a recent, massive, perturb-seq study in which more than 8,000 transcripts were knocked-down using crispr-i. See our previous post, and Mapping information-rich genotype-phenotype landscapes with genome-scale Perturb-seq for more info. This new data means that a total of about 85,000 gene lists can now be found in our database.

The study actually generated two massive knockdown datasets, one involving K562 cells, and the other involving the RPE1 line. We've added both of these datasets to the database. As we pointed out in the previous post, the K562 matrix can be read as either a series of knockdown studies (e.g. what is upregulated when gene XYZ is knocked down?), or as a crispr screen (e.g. what are the genes whose knockdown downregulates XYZ?). As you'll see below, you can examine the K562 dataset in either way. In the case of the RPE1 set, only the results of knockdowns can be examined. This is because "only" about 2,000 genes were knocked down in the RPE1 study, meaning that the background of the RPE1 crispr-screen results is fairly small. We like big backgrounds. Looking at our previous post, the K562 results can be represented as a fairly square-shaped matrix, but the RPE1 results are a long rectangle.

Integrating this data into our database wasn't entirely straightforward. The sheer volume of the data can slow down processing considerably. Also, the presence of massive data generated from a single lab, with a single protocol, with only two cell lines, wreaks havoc on the output of some of our programs. Thus, we had to tweak several of our apps to accommodate the new data.

For the Relevant Studies app, the addition of the data is not problematic. You may not be interested in these perturb-seq results, however, so a "standard" search excludes perturb-seq results. You can include perturb-seq results by scrolling down to the bottom of the black bar on the left side of the page and making a choice in the "Database" box. If, for some reason, you're only interested in perturb-seq, you can type "perturb-seq" in the "Keyword" box (be sure, of course, to choose perturb-seq in the Database box as well).

For the Co-Expression app, we don't want to mix the results of a single monster study involving two cell lines/one lab/one protocol with our standard database. All the pitfalls of the perturb-seq approach* would come to the fore and dominate results if we mixed databases. Thus you can go to "Database" and choose the standard database, the perturb-seq knockdown database, or the perturb-seq crispr-screen database, but you can't combine these datasets**. Since the "Regulation" app also performs co-expression analysis, the same database limitations apply. 

For the Fisher app, Match Studies app, and Third Set app, our main concern is speed. Thus, as with the Relevant studies app, the default is to use our standard database. Again, you can change that in the Database box.

No insight is gained by including the perturb-seq studies in our "Cell Types" app. Thus only the standard database is interrogated when you ask the question, "in what cell types does my gene of interest tend to be perturbed?"

Presumably, the frequency with which these sorts of massive datasets are released will increase in the future. We'll add these studies to the database as they come.


*Unmentioned in our previous post is the following: the results of the K562 and RPE1 knockdowns overlap quite weakly. That is, if you choose a gene that was knocked down in both studies, and look for correlation in the two altered transcriptomes, you'll probably be disappointed. The perturb-seq paper devotes a paragraph to this result, but does not really offer insight into why such weak correlation is seen. Hopefully, our previous post makes it somewhat clear that overlap between transcriptomic studies that target the same gene, but use different cell lines and targeting approaches (knockout/down, drug, etc) is not unusual or unexpected.


**You can't combine the crispr-i and crispr-screen results, either. My underlying thinking is that since one is just the transpose of the other, it's a bit incestuous to mix the two sets and then perform analysis. There's probably a name for an associated statistical error here. Admittedly, I haven't thought this out fully, but it just seems safer to keep the two sets separate.


whatismygene.com 


Tuesday, July 5, 2022

Crispr-i Vs Conventional Knockdown

It is now possible to read out the transcriptional alterations induced by alteration of every gene in the genome in a single experiment. Actually, this has been possible since the advent of microarrays, but recent advances in crispr and single-cell sequencing technologies means the feat can be accomplished without gargantuan expenditures. Crispr inhibition ("crispr knockdown" or "crispri") clogs up the promoter of any gene of interest. Bar codes allow the experimenter to know which gene has been clogged. And single-cell sequencing gives you the transcriptome of a clogged cell. After intensive computation, you get a simple matrix of genes knocked down and genes altered.


Above is a very small matrix. The yellow column shows genes that are knocked down. The blue row shows genes examined for alterations. The matrix needn't be square...in the study we'll be talking about, there were more genes examined than genes knocked down. So, you can see that knocking down pd-l1 strongly upregulates tubb in this very hypothetical example. Here, the gene of interest is found in the yellow column. But the gene of interest can also be found in the blue row. So, for example, you can ask, "What are the genes whose knockdown upregulates ifn?" There, pd-l1 knockdown does the best job of upregulating ifn. This is the approach taken in crispr and rnai experiments that ask questions like, "What genes most strongly control the expression of cancer migratory factor XYZ?"

The study of interest is here. K562 cells were used. Roughly 8,000 genes were knocked down, and 10,000 genes were examined for transcriptional alterations. Typically, 100 cells were examined for a particular knockdown, meaning that more than a million single cells were sequenced. We'll be adding the data to our database, but we need to make a few tweaks to our system to accomodate the data. However, we have some preliminary results of combining this "perturb-seq" dataset with our own data. Below, we discuss these results. They're weird.

First, a bit more background. Crispri is often referred to as a "knockdown." The gene of interest hasn't been mutated or deleted. A protein and RNA guide simply clog up a promoter. Thus, as with standard rnai, knockdown can be of varying efficiency. In both forms of knockdown, off-target effects are also possible. However, crispri differs (profoundly, we believe) from standard rnai in that the knockdown occurs right at the DNA/RNA interface, at the level of transcription, while rnai functions after full-length transcripts have already been generated. Rnai results in by-products of cleaved RNA and/or protein-bound transcripts with inhibited translation.

Despite the differences in these two knockdown approaches, it seems reasonable to expect that both sorts of knockdowns should have similar transcriptomic effects. In both cases, simple RT-PCR can tell you that the gene of interest has been stymied by, say, 90%. In both cases, there isn't much transcript floating around for translation into protein. Nevertheless, experimental comparisons between the approaches are necessary. Unfortunately, we don't see extensive examples of such comparisons. Probably the best study is found here. Surprisingly, even in a controlled setting using a single cell line (Hela), the transcriptomic readouts of crispri and rnai did not match up particularly well. We note another possible comparison here. The comparison is less than ideal, however, since the experimenters abandoned crispri in favor of rnai because of less-than-desirable knockdown efficiency.

To more closely examine the discrepancies between crispri and more conventional means of altering gene expression (knockdown/out, overexpression, drug targeting, mutation), we first sought out the most commonly altered genes in our database. TP53 ranks first, with a total of 45 studies targeting it. Unfortunately, TP53 was not strongly downregulated in the k562 perturb-seq data on which we operated; this particular crispri knockdown was not particularly effective.

The next most commonly targeted gene in the database is TGF-b, with a total of 36 studies. The gene is indeed the single-most strongly downregulated gene upon TGF-b perturb-seq knockdown. However, we have a new problem in comparing conventional studies against crispri; all but 3 of the above studies involve treatment. That is, cells are bathed in TGF-b. It would not be fair to expect perturb-seq results to parallel these treatment results. Nevertheless, we note the following:

*The single conventional TGF-b knockdown study actually mimicked TGF treatment fairly well, albeit in opposite directions (i.e. genes upregulated in the knockdown are downregulated upon treatment, and vice-versa).

*Perturb-seq results did not match up with any significance with ANY of the above 36 studies.

Given the time we spent tinkering with TGF-b data, we constructed lists of genes that are canonically up/down-regulated on TGF-b treatment: database IDs 145169203 and 145170203 (to be available upon our next database update).

EZH2 is targeted 32 times in our database. This time, it is strongly downregulated on crispri treatment. We also have a variety of knockdown/out, overexpression, mutation, drug-targeting results relating to EZH2. Do any of these studies at all match up with the perturb-seq results?

No.

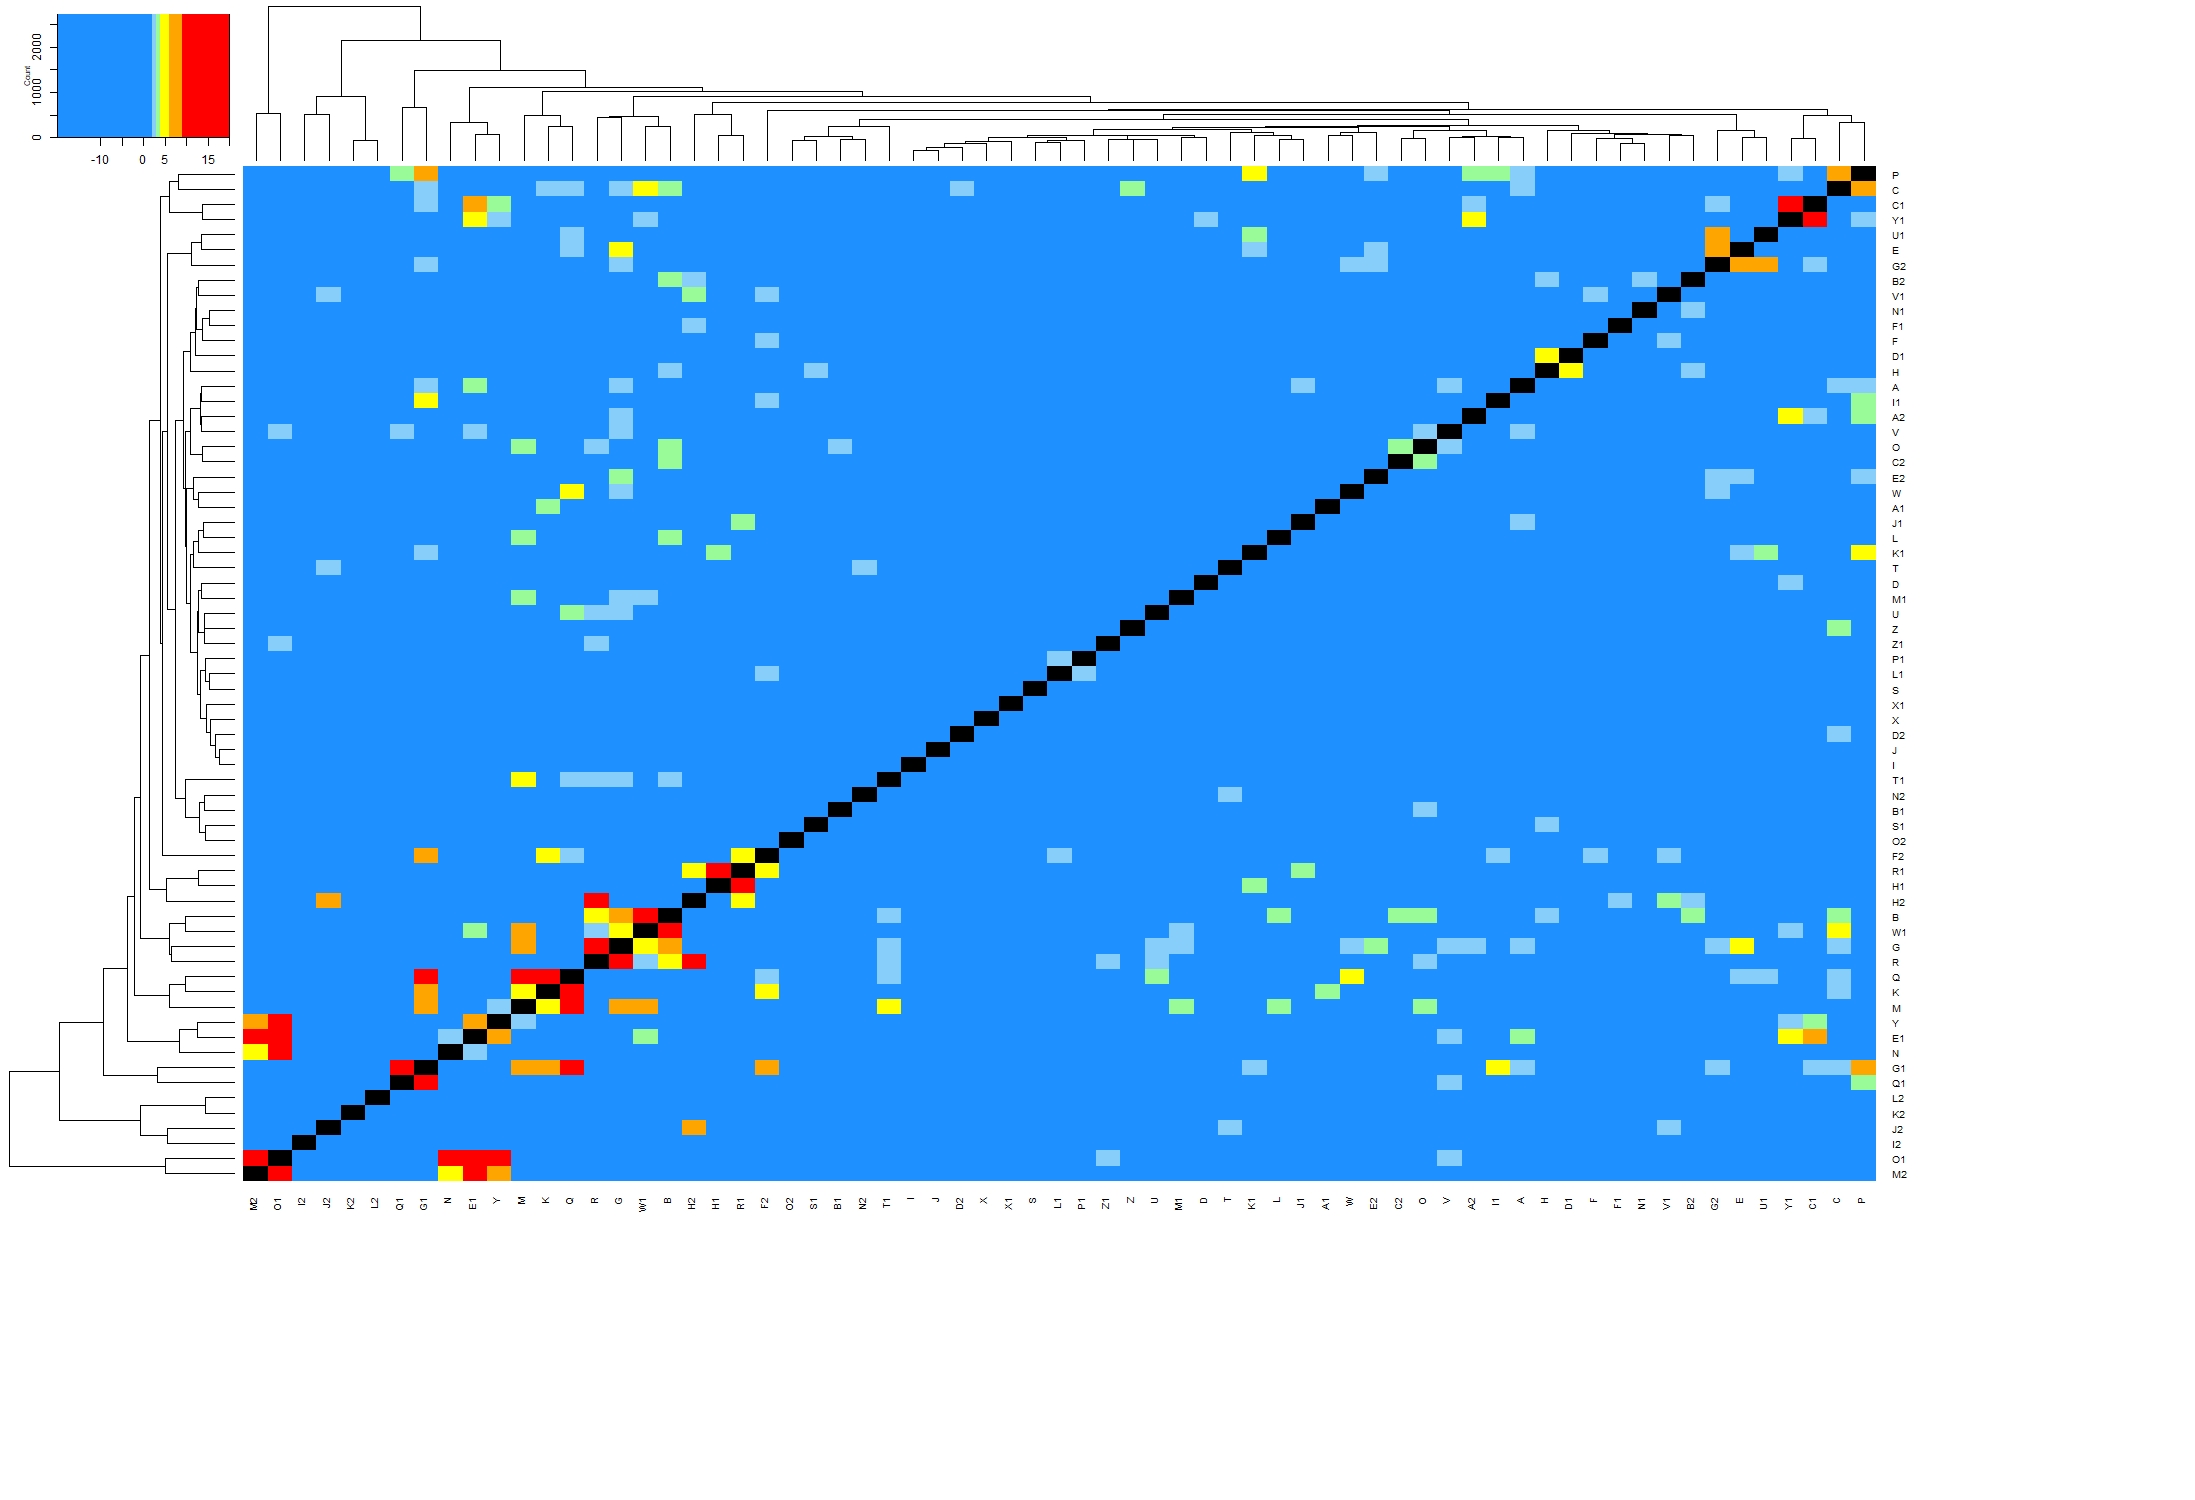
To be fair, there's not a lot of study/study overlap here. Presumably, that's because the effects of EZH2 alteration depend strongly on cell type. Below is a heat map showing EZH2 study/study P-values. Bear in mind that the underlying gene lists are divided into up- and down-regulated portions...even in a best case scenario, half of the lists aren't expected to overlap. Nevertheless, green/yellow/orange/red color makes it clear that most studies overlap with at least one other study with decent significance. The up/down lists for perturb-seq, N2 and O2, however, lie smack in the least colorful columns/rows of the heatmap. In fact, the single best EZH2-related match for perturb-seq is this: genes that are upregulated under perturb-seq crispri tend to be downregulated under standard EZH2 KO in an MBA-MB-231 line (log(P)=-2.8, see GSE48979).


Given the plethora of EZH2 studies, we compiled lists of genes that are canonically altered upon EZH2 targeting: dbase IDs 145171203 and 145172203. As one might guess, however, EZH2 alteration doesn't tend to affect particular genes repeatedly from study to study. The single strongest tendency was for IGF2BP3 to be upregulated on EZH2 downregulation, but this was only seen in 6 of 30 studies. Nevertheless, it was interesting to see that the list of genes that are canonically up-regulated on EZH2 downregulation overlapped strongly with a number of viral infection studies. For example, genes that are downregulated in foreskins on 96-hour HCMV infection (vs 12 hours; see GSE112514) overlap with genes canonically downregulated on EZH2 knockout at log(P) = -21. It seems that viruses are motivated to see EZH2 sequestered and/or knocked-down.

If I were writing an academic paper, I'd continue with the above sort of analysis, showing that standard knockout/down, overexpression, drug inhibition, and mutation studies involving a particular target can be found to overlap to some extent, but crispri simply does not overlap with these studies.


whatismygene.com 


Mixing WIMG and AI

We've been tinkering with incorporating AI (Gemini) with our Fisher app. The idea is not so tricky...you feed the AI an identity/ruleboo...